My Spotify Data
I collected the data from my Spotify Wrapped during the years 2020, 2021 & 2022 and visualized it.
Is alcohol- and drug use equal to success (among writers)?
The assignment was to use an enormous amount of data about writers, their successes and certain happenings in their lives.
I chose to answer the following question:
Is alcohol- and drug use equal to success?
Alcohol and drugs are a big part of the arts industry, this includes writers. But do you have to be under the influence of alcohol or drugs in order to gain success/win awards?
* disclaimer: it was mostly about writers from the 1800-1900s, this is clearly reflected in the alcohol/drugs of choice *
3D Data Visualization
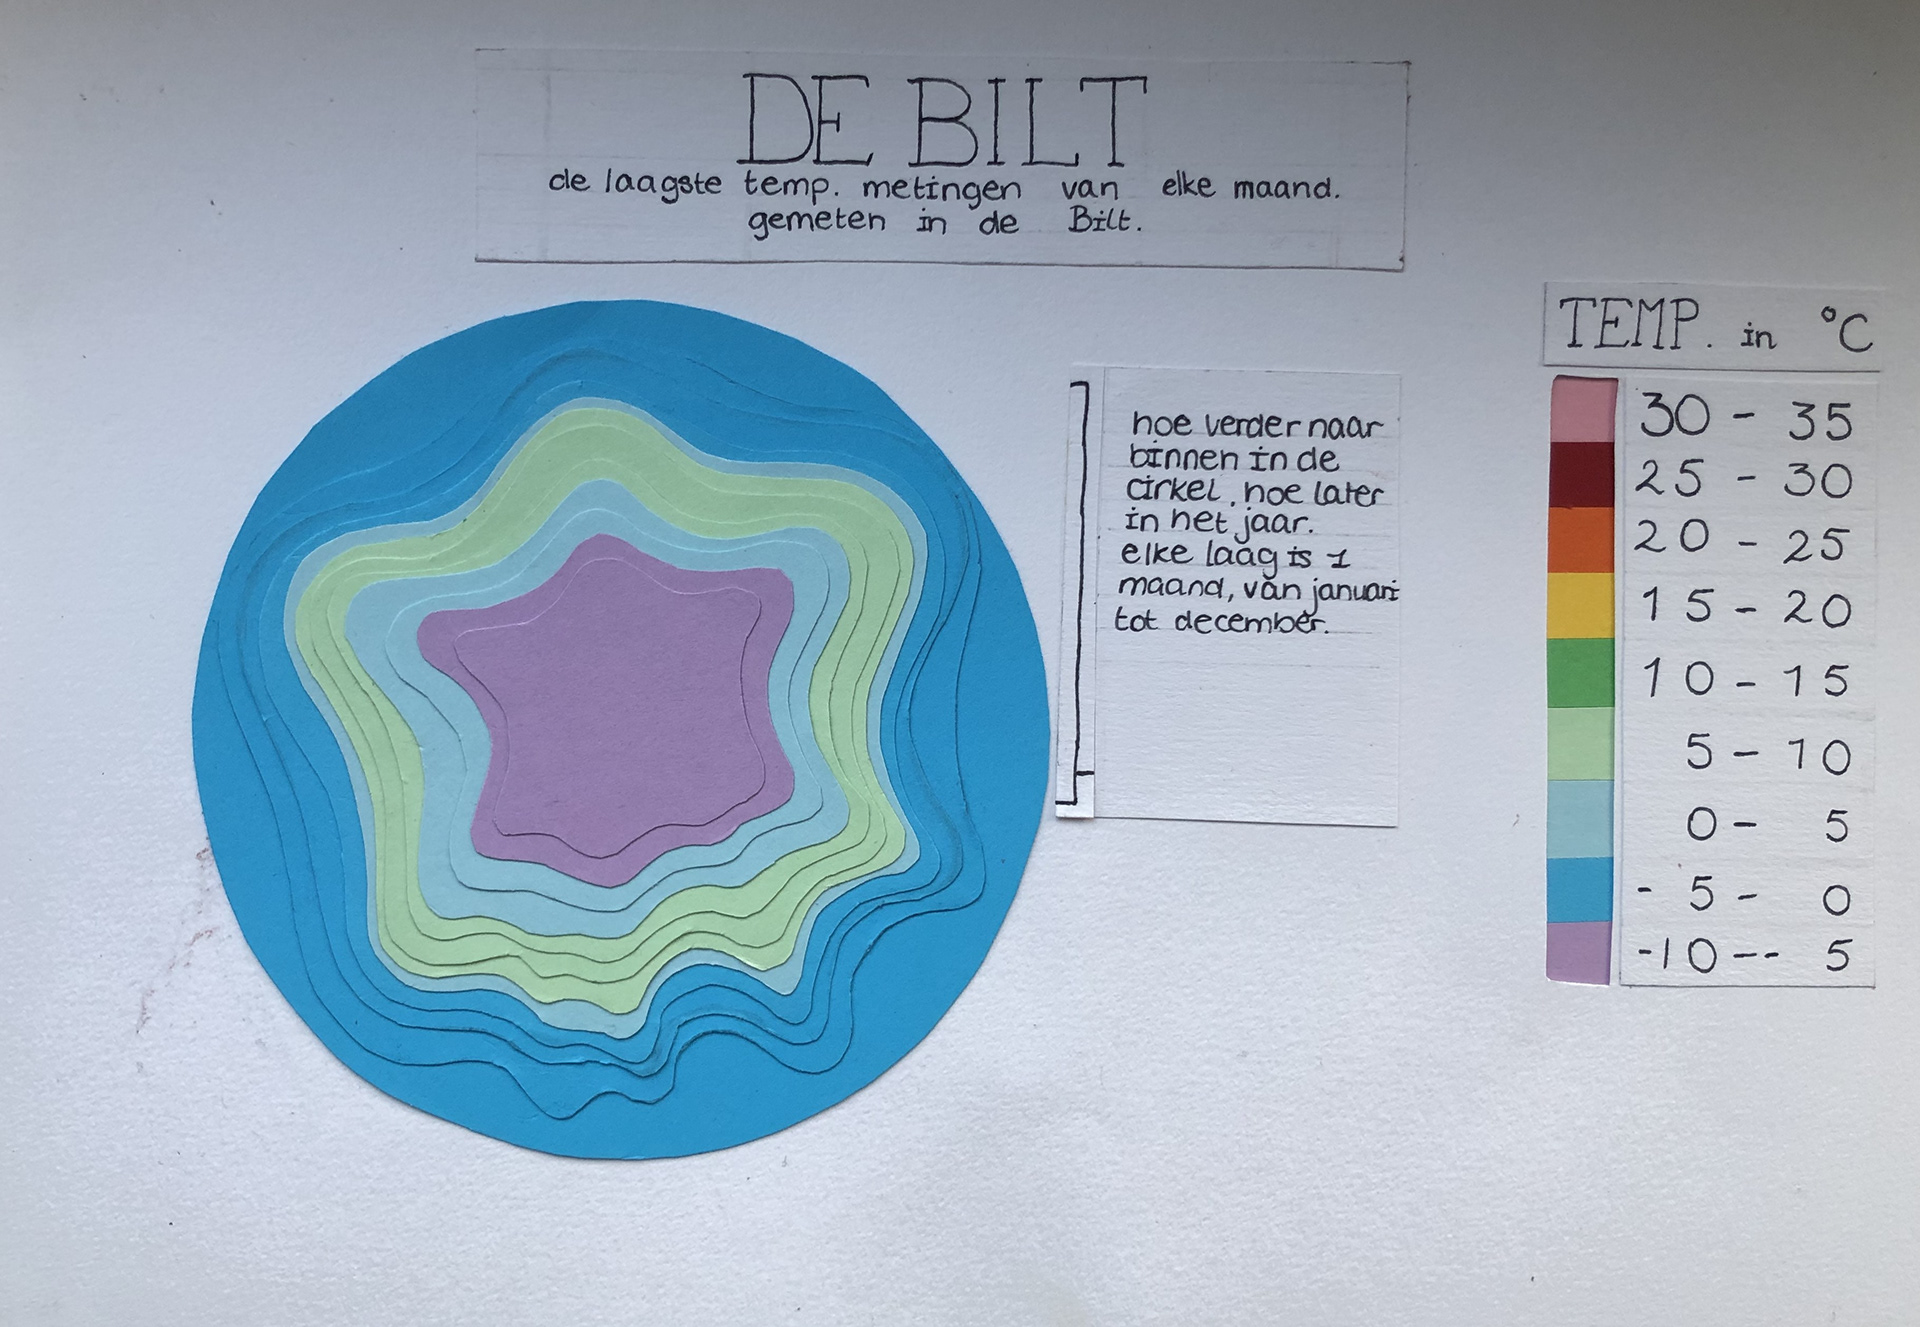
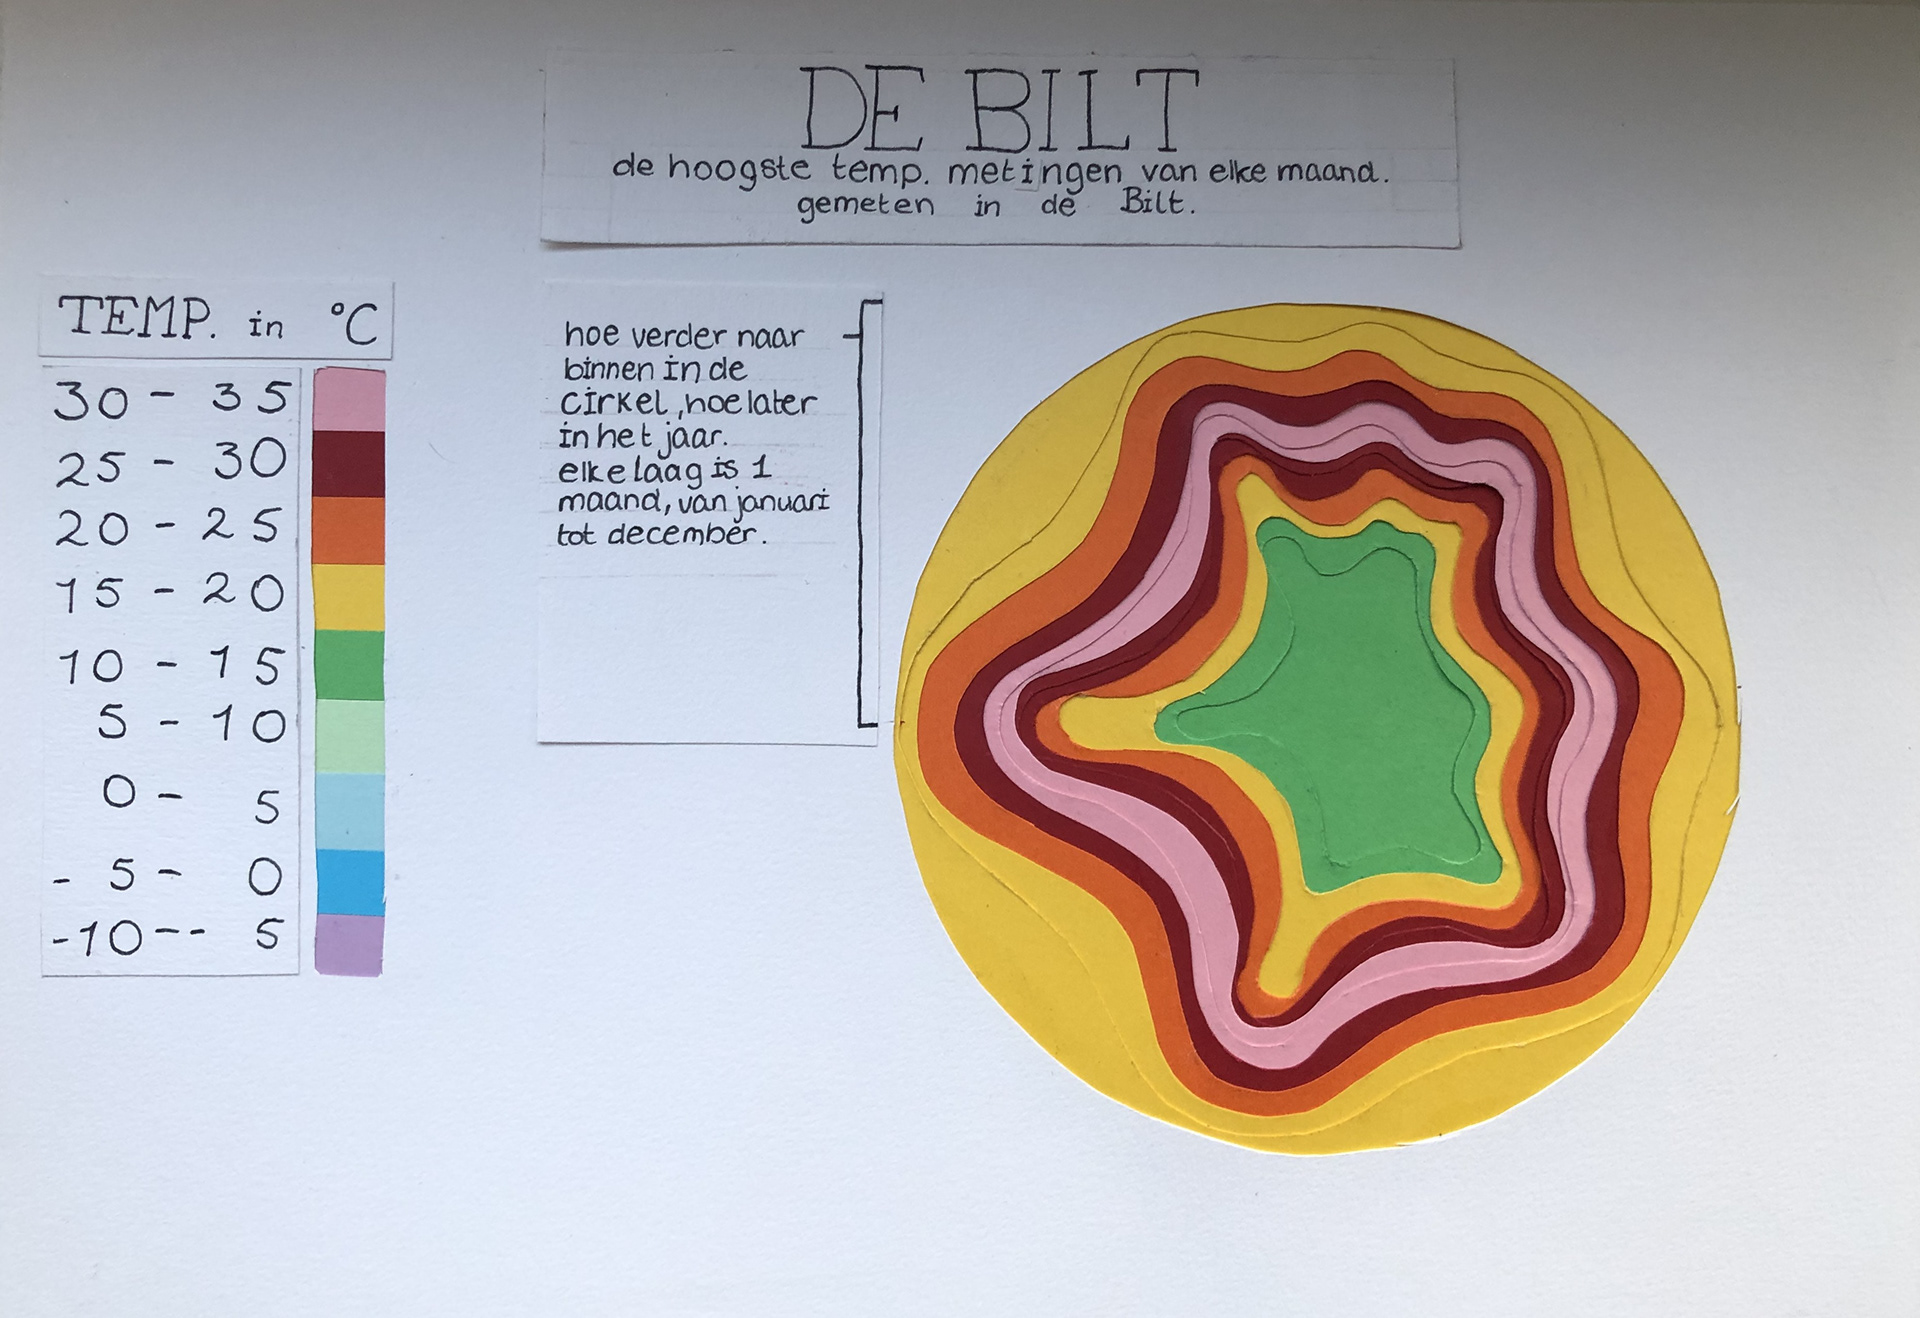
I visualized the coldest and hottest temperatures of each month measured in 2022 (location: The Bilt) by layering different colors of paper atop each other. Each color stands for a different temperature range and each layer stands for the month it was measured in.
1) The coldest temperatures, building up.
2) The hottest temperatures, building down.
2) The hottest temperatures, building down.

The coldest temperatures of each month, measured in 2022 (3D upwards)


